A real-time report of analysis by Carl T. Bergstrom and Jevin West.
December 8, 2016: This morning, Elsevier's Scopus released their CiteScore journal metric. This new metric is intended as an alternative to the popular Thomson-Reuters (now Clarivate Analytics) Impact Factor.
Some commenters have expressed concern, however, about a possible conflict of interest in the production this new metric. Elsevier not only owns the division (Scopus) that produces the CiteScore rankings, but also publishes a large fraction of the journals ranked therein. We consider it unlikely that Scopus is actively tampering with the citation counts or article counts in order to benefit Elsevier publications. But it does seem worth asking whether the particular choice of metric benefits Elsevier's publishing interests.
Over the next few days, we will be presenting a preliminary analysis here.
Effect on Nature Publishing Group
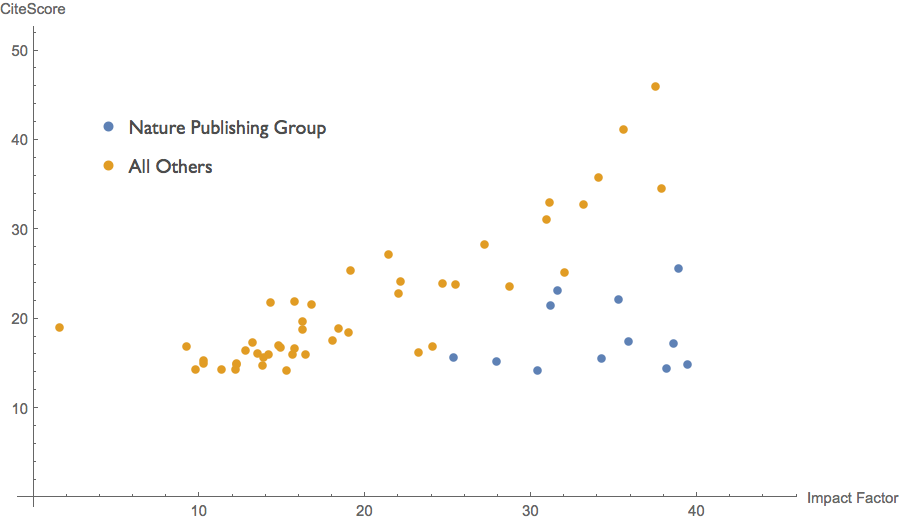
The scatterplot below shows the 60 highest-scoring journals (listed in both Scopus and the JCR) according to CiteScore ranking. On the horizontal axis is Impact Factor; on the vertical axis is CiteScore. (We've omitted Ca-A Cancer Journal for Clinicians from our analysis, as this is a massive outlier on both scales).
Looking at these data, one of the first things that leapt out at us is that there is a remarkable difference between the CiteScores that Nature-branded journals receive and the CiteScores that other journals with similar Impact Factors receive. The Nature journals are receiving much lower CiteScore values than we would expect given their Impact Factor scores. In other words, the Nature Publishing Group journals are taking a huge hit by this new metric.
This is not an artifact of looking at the top 60 journals only. We can look the 9527 journals listed in both the JCR and in Scopus for which we could match names or ISSN numbers. The lines show least squares linear regression through the origin for Nature-branded journals and for all others.
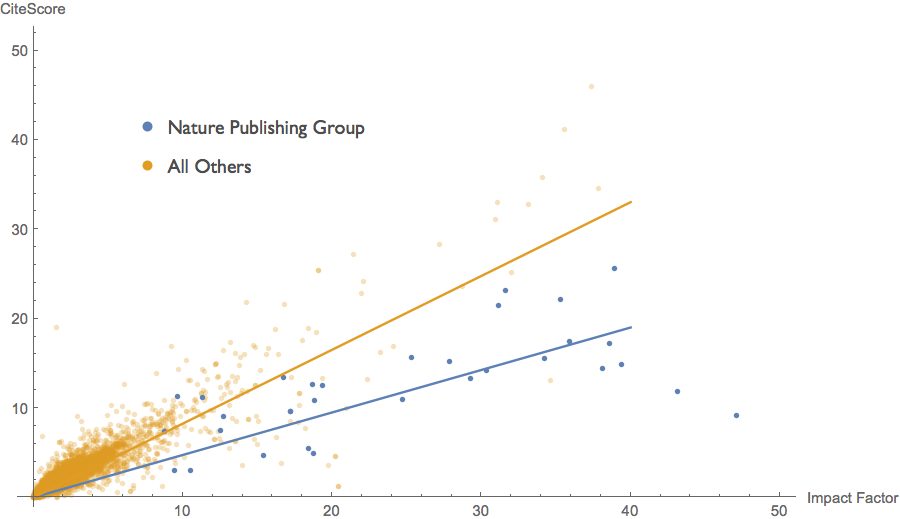
The big difference in slopes shows us that Nature journals are getting CiteScore values far worse than we would expect given their Impact Factor. In fact, the slope of the regression line for Nature journals is 0.475 whereas the slope for all other journals is 0.826. This means that Nature-branded journals are taking a bit more than a 40% hit as we move from Impact Factor to CiteScore.
Because the vast majority of the journals have modest scores, we can get a better sense of what is going on by looking at these data on a log-log plot. Below we have the same straightforward linear regression above, but now plotted on a log-log scale. On a log-log plot, the regression lines from above now appear as parallel lines with slopes of 1, because both curves are of the form y=ax. The difference in slopes that we observe in the original linear plot now manifests as a vertical offset.
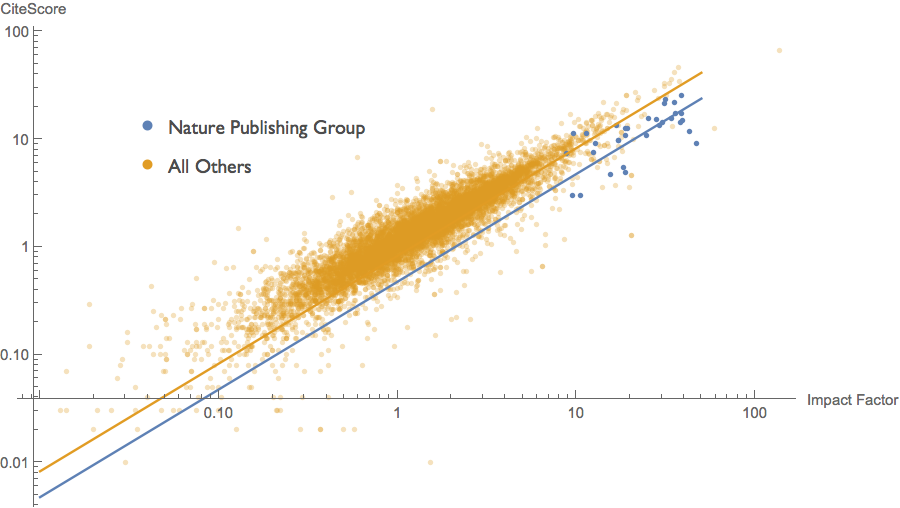
Why are the Nature journals faring so poorly according to CiteScore? The biggest contributing factor is the CiteScore counts all items, including news items, editorials, and other front matter, as "citeable" and thus including in the denominator of the CiteScore calculation. In practice, this front material is seldom cited and so rarely contributes substantively to the numerator. Because the Nature journals produce much more of this front material than the other journals in the top 60, their scores are highly diluted.
Effect on Elsevier journals
Nature Publishing Group was just the opening act. What you probably came here to find out is the effect on Elsevier journals. Based on our preliminary analysis, this effect is substantial.
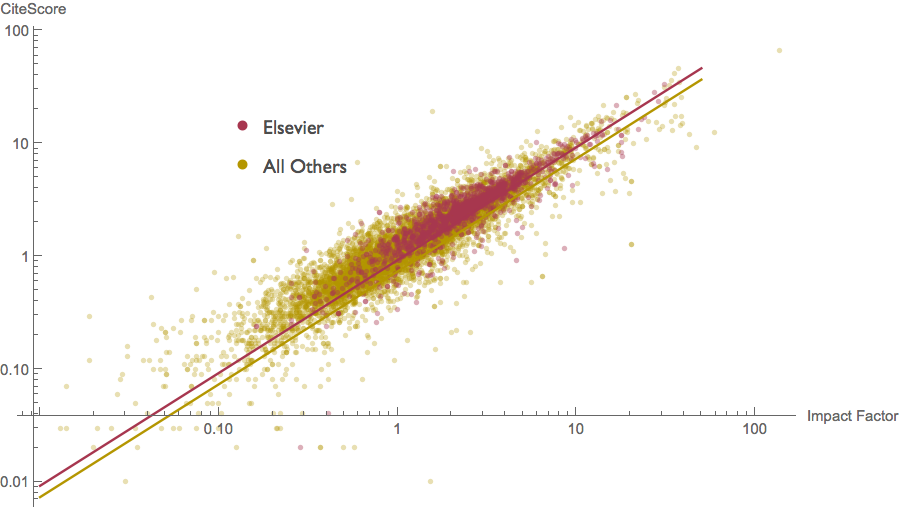
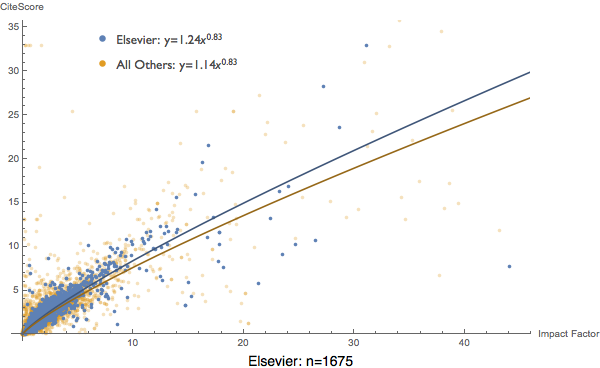
Below we have another scatterplot of our 9527 journals, this time showing Elsevier journals compared to all other journals. The lines indicate least squares linear regression through the origin.
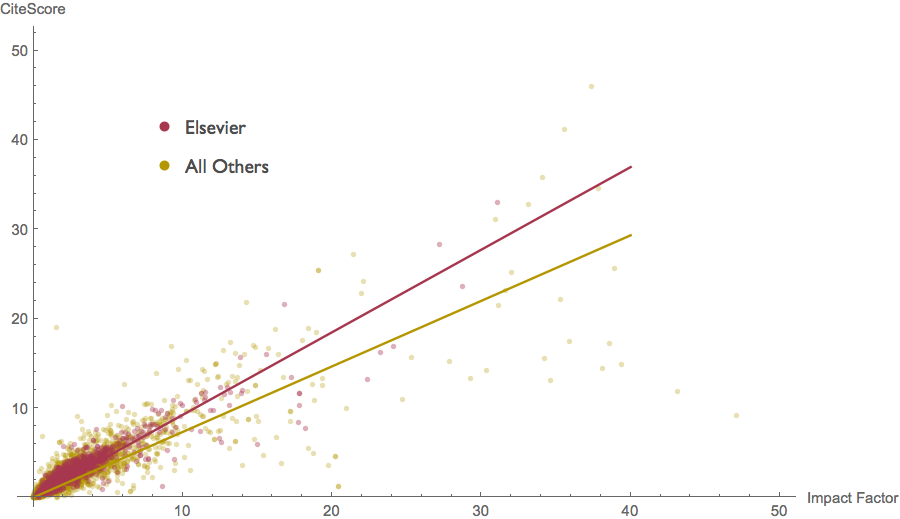
Again we see a sizeable difference in slopes, but here the slope is higher for Elsevier journals than it is for the other journals. The gap is not as big as we saw for the Nature journals, but it is not small either. The slope of the Elsevier regression line is 0.924 whereas the slope of the line for the other journals is 0.733. This means that Elsevier journals are getting just over a 25% boost relative to what we would expect given their Impact Factor scores.
Again it is useful to look at this same scatterplot and regression on a log-log scale, to better see what is going at lower scores where most journals reside.
So what does this mean? If our preliminary analyis is correct, it means that Scopus has chosen a metric that quite strongly favors the portfolio of journals held by its parent company Elsevier. To be clear, we are not arguing that Scopus has cooked the numbers in any nefarious way. That strikes us as very unlikely. What they may have done, it appears at this early stage, is to cleverly employ the many degrees of freedom that one has when designing a metric, so as make the Elsevier journals look very good.
There is plenty of additional analysis to be done, but we want share these first looks at the data with the community immediately.
December 9th 2016. Though the vast majority of journals in the JCR and Scopus databases have small or modest Impact Factor and CiteScore values, the linear regressions above are heavily influenced by a few dozen elite journals with very large Impact Factors and CiteScore values. Much, but not all, of the advantage that Elsevier journals enjoy from the CiteScore metric accrues simply because they do better than one would predict, taking the very low CiteScore values of all of the high-impact Nature journals into account.
Thus while Elsevier gets a 25% boost relative to the predictions of the linear regression model through the origin, they do not fare 25% better than the majority of their competitors. Compared the non-Nature journals, Elsevier journals get only a 15% boost from the use of CiteScore instead of Impact Factor. If we discard Ca-A Cancer Journal for Clinicians with its 137.6 impact factor from our data set as an outlier, Elsevier's boost drops yet further.
So while it will be interesting to better understand the source of this Elsevier boost, we think that perhaps the biggest story here will turn out to be the first thing that leaped out from the data: the huge hit that the Nature journals' scores would take if the CiteScore metric were to become widely adopted.
Is the CiteScore metric fair?
A metric cannot really be said to be fair or unfair; it is either well-suited or not well-suited to a particular purpose. So what one really means with a question like this is something like "Is the CiteScore metric well-suited for evaluating journal quality and prestige?"
Before addressing that question, let's take a look at how Impact Factor and CiteScore are calculated. Each metric is a ratio of incoming citations to articles published, but the metrics differ in terms of which incoming citations get counted in the numerator and which articles get counted in the denominator. The figure below illustrates. A journal publishes a set of NF front matter articles (blue rectangles) followed by a set of NC regular research articles (red rectangles). Both types of articles receive incoming citations (black arrows). The front matter articles receive CF citations collectively and the regular research articles receive CR citations collectively.
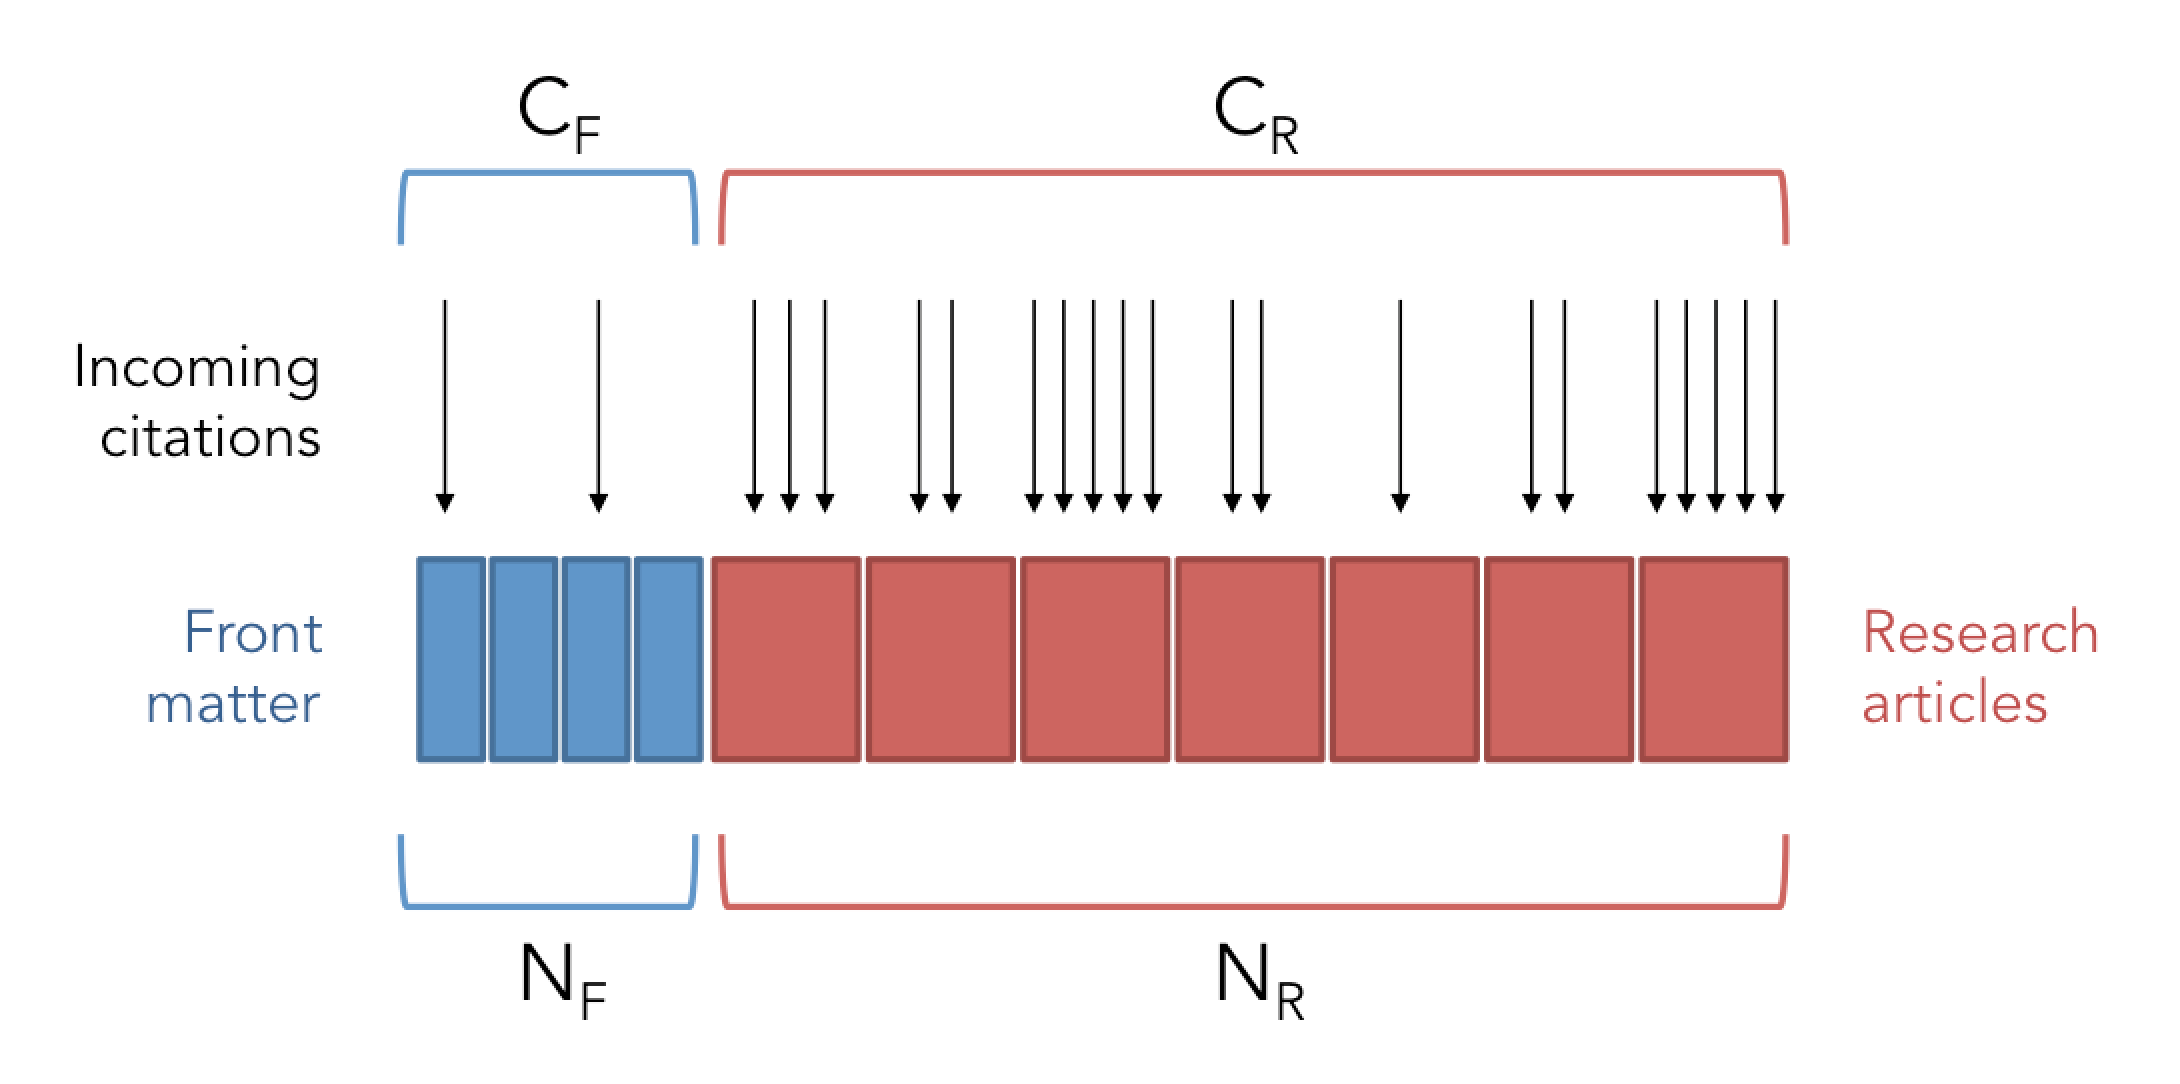
The Impact Factor is calculated as all incoming citations divided by the number of regular research articles: IF=(CF+CR)/NR. The CiteScore, by contrast, includes all articles, whether front matter or research articles, in the denominator: CS=(CF+CR)/(NF+NR).
Impact Factor is often criticized because citations to front matter and other "non-citeable items" count toward the numerator but not the denominator of the score. As a result, journals that produce large amounts of front matter are probably receiving a bit of an extra boost from the Impact Factor score. The CiteScore measure eliminates this boost, at the expense of including all of the front-matter articles, however rarely cited, in the denominator.
If one is seeking a measure of journal prestige to use in assessing CVs and the likes, the proper balance seems obvious to us: distinguish between citeable and non-citeable items as is done when computing the Impact Factor, but count only the citeable items toward both the numerator and the denominator: CR/NR. This score would tell you how many citations the average regular research article in the journal receives. (That said, evaluating individual articles using journal level metrics is problematic for all of the reasons usually discussed.) If front matter is rarely cited, i.e., CF/CR≈0, Impact Factor will approach our desired formula. If front matter is cited roughly as often as regular research articles, i.e.,CF/CR≈1, CiteScore will approach our desired formula. We suspect that the ratio CF/CR will be much closer to 0 than to 1, but this is an empirical question that merits careful analysis.
Reasonable arguments can be made for both the Impact Factor and CiteScore formulations, however. Recall that the Impact Factor was not originally developed for its current role as a single-number alternative to reading someone's paper, but rather as a tool for selecting journals to include in the ISI's Science Citation Index (now the Clarivate Web of Science). Lest small but important journals be overlooked when using raw citation counts, Eugene Garfield developed Impact Factor as a size-normalized measure of influence. Because front matter is an important coontributor to the values of a non-trivial minority of journals, it arguably makes sense to include these in citation counts. But to estimate the size of a journal, the number of regular articles may be a better proxity. Is it reasonable to say that a journal with 120 news stories and 24 articles a years is the same size as a journal with 144 articles a year? One publishes two articles a month, one twelve. Rather than equating front matter and regular articles, Garfield chose to normalize by the part of the journal that receives most citations and takes up most of the pages in a volume. For his original purpose, this choice seems sensible.
The best argument we see for taking the CiteScore approach is that front matter and regular research articles are not as easily distinguished as one might think. While it seems straightforward to separate a News and Views piece from a Nature article, what should one do about the shades of grey such as responses to target articles? For a target-reponse journal such as Behavioral and Brain Sciences this decision has an enormous effect. CiteScore's defenders have pointed out that Scopus would certainly be accused of bias if it were to make this call for its own journals, and we agree that such accusations would be pretty much a given. That said, our solution would not be to lump front matter in with regular articles. Rather, our solution would be for a major journal publisher to stay out of the metrics business. Imagine what would happen to the credibility of Kelley Blue Book or Consumer Reports if purchased by Ford or General Motors.
We conclude with a note about the perverse incentives that metrics create. By neglecting to count the front matter in its denominator, Impact Factor creates incentives for publishers to multiply ther front matter. By counting front matter fully in the denominator, CiteScore does the reverse. Because we value and enjoy the front matter in many of our favorite journals, we see the Impact Factor as the lesser of evils in this regard. Should CiteScore ever reach the level of prominance that Impact Factor currently holds, journals will face strong incentives to reduce or eliminate the news and editorials that appeal many readers. It would be a great shame to see this content shrink or disappear.
Final note: Ludo Waltman at CWTS has published an interesting set of comments on this issue. We largely concur with both the arguments and recommendations therein .
Effect on journal ranks
A number of people have asked to see an analysis of how journal rankings change as one moves from Impact Factor to CiteScore. Our opinion is that looking at the cardinal scores is more useful; moving to ordinal ranks simply throws away a large amount of information. But we suppose that editors and such like to talk about their journal's rank, and because this appears to be of interest to many, we have put together a basic analysis.
We begin by tabulating the mean change in journal rank for all publishers who publish at least 30 journals listed in both the JCR and Scopus. In the table below we show these mean changes, as well as 95% confidence intervals on our estimates of the means as well. Many of the publishers experience significant changes in average journal rank. Publishers showing a significant improvement in rank such as Elsevier, are indicated in black. Publishers showing a significant decline in rank, such as the Nature-branded journals, are shown in red.
| Publisher | Number of Journals | Mean Change in Rank |
|---|---|---|
| American Chemical Society | 39 | 48 ± 51 |
| Annual Reviews, Inc. | 35 | 223 ± 155 |
| American Psychological Association | 40 | 269 ± 228 |
| Bentham | 33 | -118 ± 153 |
| Cambridge University Press | 192 | -247 ± 185 |
| Elsevier | 1,462 | 127 ± 49 |
| Emerald | 45 | 1,317 ± 294 |
| Hindawi | 39 | -410 ± 320 |
| IEEE | 129 | 1,294 ± 222 |
| IOP Science | 32 | -701 ± 529 |
| Karger | 77 | -177 ± 204 |
| Maik Nauka/Interperiodica | 75 | -243 ± 97 |
| Mary Ann Liebert | 42 | -556 ± 235 |
| Oxford University Press | 149 | -123 ± 156 |
| SAGE | 357 | 452 ± 127 |
| Nature journals | 32 | -173 ± 137 |
| Springer Nature | 1,177 | -81 ± 55 |
| Taylor & Francis | 975 | 111 ± 69 |
| Thieme | 43 | -479 ± 301 |
| University of Chicago Press | 34 | 308 ± 389 |
| Walter de Gruyter | 32 | -159 ± 552 |
| Wiley-Blackwell | 1,055 | -30 ± 59 |
| Wolters Kluwer Health | 193 | -561 ± 142 |
| World Scientific | 42 | -210 ± 333 |
In this table, the biggest winner in terms of rank change is Emerald Group publsihing. By some odd coincidence, they seem to have been involved in developing CiteScore.

Of course, looking at means alones isn't nearly as informative as looking at the entire distribution. We can, for example, compare how the 45 Emerald journals do relative to all other journals. Bars indicate the fraction of journals falling into each category. Most Emerald journals increase substantially in rank, and several increase by 2000 places or more.
Getting back to our comparisons between Elsevier journals and Springer Nature journals, we see that a majority of Elsevier journals impove their rank as we move from Impact Factor to CiteScore, whereas a majority of the Spinger Nature journals slip in rank.
Looking at absolute changes in rank is probably a bit misleading, however. Viewed this way, a journal that moves from 9050th place to 9000th place has a bigger change in rank than a journal that moves from 59th place to 10th place. But the latter seems to be a much bigger and more important increase.
We see this is striking fashion when we compare the Emerald journals with the Annual Reviews Inc. journals. No Emerald journals in our data set are ranked in the top 1000 journals by Impact Factor, and most are ranked in below 5000th place. By contrast, more than half of the Annual Reports journals are ranked among the top 200 journals by Impact Factor.
Both publishers benefit from switching to CiteScore, but if we consider absolute changes in rank, Emerald benefits far more.
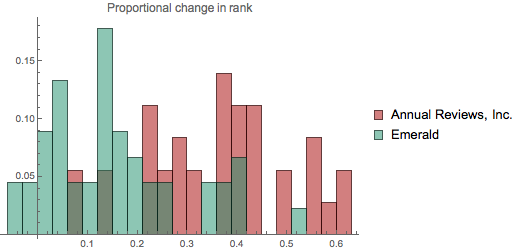
But relative to their rankings by Impact Factor, the Annual Reviews Inc. journals move even more when we switch to CiteScore. To quantify this, we look at the proporational change in a journal's rank, which we define as (RIF - RCS) / (RIF + RCS), where RIF is the journal's rank by Impact Factor, and RCS is the journal's rank by CiteScore.
Below we see that Annual Reviews Inc. journals have larger proportional changes in rank than do Emerald Journals.
We can construct a table of these proprotional rank changes as well. This tells a similar story to that of our previous table, but now the Annual Reviews journals leap out as the big winners, and the Nature journals as the big losers from the shift to CiteScore.
| Publisher | Number of Journals | Mean Proportinal Change in Rank |
|---|---|---|
| American Chemical Society | 39 | 0.08 ± 0.05 |
| Annual Reviews, Inc. | 35 | 0.36 ± 0.05 |
| American Psychological Association | 40 | 0.08 ± 0.06 |
| Bentham | 33 | -0.01 ± 0.02 |
| Cambridge University Press | 192 | -0.03 ± 0.02 |
| Elsevier | 1,462 | 0.03 ± 0.01 |
| Emerald | 45 | 0.15 ± 0.04 |
| Hindawi | 39 | -0.04 ± 0.03 |
| IEEE | 129 | 0.32 ± 0.04 |
| IOP Science | 32 | -0.12 ± 0.08 |
| Karger | 77 | -0.04 ± 0.04 |
| Maik Nauka/Interperiodica | 75 | -0.02 ± 0.01 |
| Mary Ann Liebert | 42 | -0.08 ± 0.04 |
| Oxford University Press | 149 | -0.03 ± 0.03 |
| SAGE | 357 | 0.06 ± 0.02 |
| Nature journals | 32 | -0.43 ± 0.11 |
| Springer Nature | 1,177 | -0.02 ± 0.01 |
| Taylor & Francis | 975 | 0.01 ± 0.01 |
| Thieme | 43 | -0.06 ± 0.05 |
| University of Chicago Press | 0.03 ± 0.07 | |
| Walter de Gruyter | 32 | -0.02 ± 0.06 |
| Wiley-Blackwell | 1,055 | -0.01 ± 0.1 |
| Wolters Kluwer Health | 193 | -0.10 ± 0.02 |
| World Scientific | 42 | -0.03 ± 0.03 |
On Conflicts of Interest
Given the extensive commentary and sometimes heated discussion surrounding the new CiteScore metric, it is probably helpful to be very explicit about what we believe our results tell us, and what they do not tell us. Do we think Elsevier is fudging the numbers? Not at all. So does this mean we can stop worrying a possible conflict of interest? We don't beleive that either. Below we explain in futher detail.
We have found that Elsevier journals receive a boost from the CiteScore metric relative to the Impact Factor. This does not imply that Elsevier has cheated, fudged the data, acted dishonorably, or anything of the sort. As we mentioned above, we have no reason to think that Elsevier is doing anything other than accurately calculating the metric that they have selected. Moreover, while Elsevier journals fare well under the CiteScore metric, the journals of some other publishers — most notably Annual Reviews, IEEE, and Emerald — fare better stil.
That said, there is still cause for concern regarding conflicts of interest. Like so much else in the world today, it is easy to view this in light of the forthcoming change in the American presidency. Suppose that as president, Donald Trump enacts a new policy that benefits the Trump Organization. How do we react? Naturally, there will be serious concerns about the objectivity of this policy decision. If some companies benefit more than does the Trump Organization, this does not assuage such concerns. The president may not have had a ready mechanism by which to single out his own organization to receive the bulk of the spoils, for example. But note that enacting a policy that benefits the Trump Organization is not hard proof of unethical behavor on Trump's part either. Some very good policies (such as not leading the US into a nuclear war, for example) will help the Trump Organization, and may help his company more than many other companies.
The heart of the problem is that if Trump continues to control his business interests as well as US policy, we will rarely be certain he is putting the country first and his net worth second. Even if there are good arguments for the policies he has chosen, we will never know if there were even better potential policies that he discarded because of their consequences for his business. The only adequate solution is, as the US Office of Government Ethics has just declared, for the president-elect to "divest himself of his vast business interests while in the White House."
In metrics, as in politics, we hope that those in charge will be objective in their judgement and free from conflicts of interest. The problem with Scopus producing metrics such as CiteScore is of course that their parent company Elsevier publishes a sizeable fraction of the journal that this metric evaluates. Thus when Elsevier makes a decision about how the metric should be designed — e.g. to include front matter in the denominator — people will justifiably wonder whether this decision was made for purely bibliometric reasons or for financial ones as well. The only solution that we see is analogous to the proposal from the US Office of Government Ethics. For a journal metric to be fully credible, the organization producing and promoting this metric must be financially independent of the organizion publishing the journals that it ranks. This is not a new problem, but rather a continuation of our long-running discomfort with the vertical integration of an infometrics company Scopus and a big publisher Elsevier.
As a final note, one commenter was concerned that as the creators of the Eigenfactor metrics, we ourselves may have undisclosed conflicts of interest with respect to CiteScore. We had thought that posting our analysis on the offical Eigenfactor.org journal rankings webpage and tweeting about it from the official @eigenfactor twitter account was an extremely straight-forward acknowledgment of our relationship with the Eigenfactor metrics. But lest it be a source of confusion to anyone: We, Jevin West and Carl Bergstrom, developed the Eigenfactor metrics, we maintain the Eigenfactor.org website, and we are the ones conducting the analysis of CiteScore presented on this page . The same commenter raised the issue of our relationship with Thomson-Reuters/Clarivate. We clearly explain this relationship on our About page that you can reach from the link at upper right. See FAQ questions 6 and 7. The tl;dr version is that we receive no financial compensation from Thomson-Reuters/Clarivate and have no financial interest in their success, but we do share data bidirectionally and we allow them to use our trademark.
Lancet Publishing Group
It won't come as a surprise to anyone who works in the area of data science, but this past week most of our time on this project has been spent cleaning data. Our initial analyses were based on a quick and dirty matching between the Clarivate data and the Scopus data; we've added 1330 additional journals this week and fixed a number of other data issues.
In that initial anlaysis, we noted the huge hit that the Nature-branded journals take as one switches from Impact Factor to CiteScore. Nature Publishing Group is not alone in this; a number of top journals suffer and in particular the Lancet family of journals also take a devastating hit, for similar reasons. Below, linear regressions through the origin for the Lancet Publishing Group journals and for all other journals.
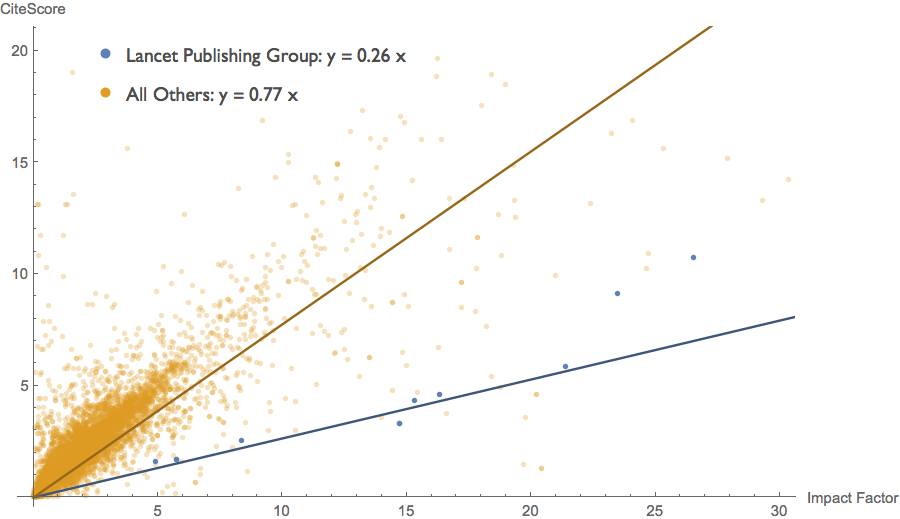
Here we see that on average the Lancet journals receive CiteScores only 1/3 as high as one would expect given their Impact Factor scores. This is an even greater decline than the Nature journals suffer.
Though listed in Scopus as published by the Lancet Publishing Group, the Lancet family of journals is owned by Elsevier. Because of title-matching difficulties, our initial analysis did not include these Lancet titles. Once we add them to our dataset and assign them to Elsevier, they pull the linear regression for Elsevier down substantially (but they have only a very small effect on our analyis of changes in rank).
Thus we want to stress that Elsevier's new CiteScore metric substantially undervalues their own Lancet family of journals relative to Impact Factor. Once the Lancet family of journals are assigned to Elsevier, our linear regression model reveals that Elsevier receives "only" a 12% boost relative to all other journals in the dataset from the use of CiteScore instead of Impact Factor.
That said, straightfoward linear regressions on these data are driven much too forcefully by a very small number of high-impact journals. We've already seen a hint of this in the sensitivity of these linear regressions to outliers. As we will discuss in the next installment, we can find better ways of analyzing these data.
Power law (log-log) regression
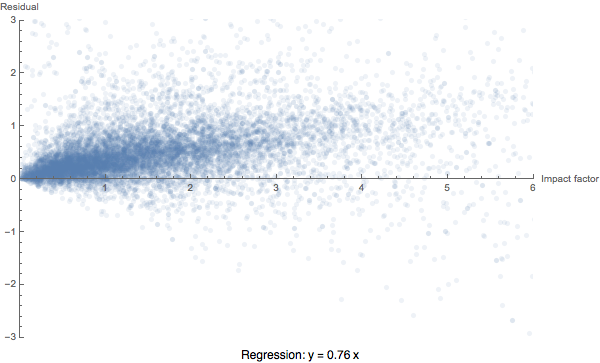
We started our analysis with the natural first approach: a linear regression of CiteScore on Impact Factor, constraining our curves to pass through the origin. Where yi is the CiteScore of the i-th journal and xi is the Impact Factor of the i-th journal, this regression approach corresponds to a model of the following form: yi = a xi + εi. Our aim with the regression is to estimate the exchange rate a that best represents the conversation of Impact Factor into CiteScore.
But we run into a problem. In this model, the εi normally distributed error terms are independent of the independent variable and contribute additively to the value of the dependent variable. In practice, our data look somewhat heteroscedastic. Worse still, the linear regression is clearly not doing a good job of fitting the data. We can see this best if we focus on the region of relatively low impact journals where the vast majority of our data points lie. The residuals increase dramatically as the independent variable (Impact Factor) increases, whereas in a well-fit model the errors should be independent of the independent variable.
One might hope that this is a consequence of constraining the regression to go through the origin. It's not, as we see right away if we look at the residuals from a linear regression with a free intercept.
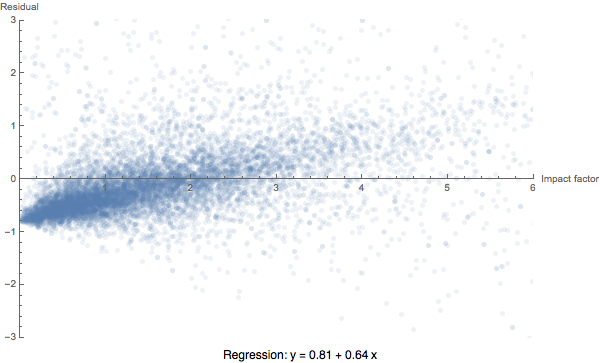
Here the problem appears almost worse; the residuals are negative for low Impact Factor scores, and increase strongly with Impact Factor. Clearly a linear model does not adequately fit these data.
There are a number of different approaches we could take to deal with this problem, but one natural approach is to log-transform both the dependent and independent variables. We can think of this as a generalization of our linear regression through the origin. In this approach, our model takes the following form: yi=a xibεi. This is known as a power regression and can be computed either directly or by log transforming both the x and y variables, taking a least squares linear regression of the transformed values, and back-transforming. In this model, the error terms contribute multiplicatively to the value of the dependent variable: we expect to see larger deviations from the regression curve for journals that have larger impact factors. (Note that for this power law model the regression curve does not provide an unbiased estimate of the dependent variable given the value of the independent variable.)
With this power regression, we indeed get a much better fit. The sum of squared errors drops substantially relative to the two-parameter (slope and intercept) linear fit. Moreover, the distribution of our residuals is substantially improved in that they don't vary systematically with the independent variable Impact Factor.
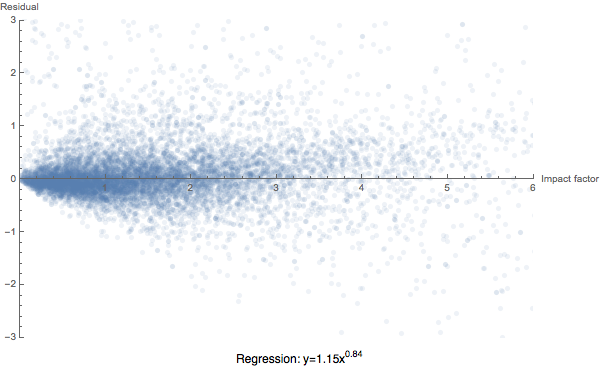
Finally, the fit is now almost completely insensitive to the inclusion of the outlier Ca-A Cancer Journal for Clinicians. (For comparison, removing that one journal changes the slope of the linear regression through the origin by more than 5%.)
So, what happen's to Nature's loss and Elsevier's gain if we move from linear regression to power law regression? Let's start with the Nature-branded journals. The power law regression curve for the Nature journals again reveals that these journals have CiteScores that are 40%-25% lower than would be expected given their Impact Factors.
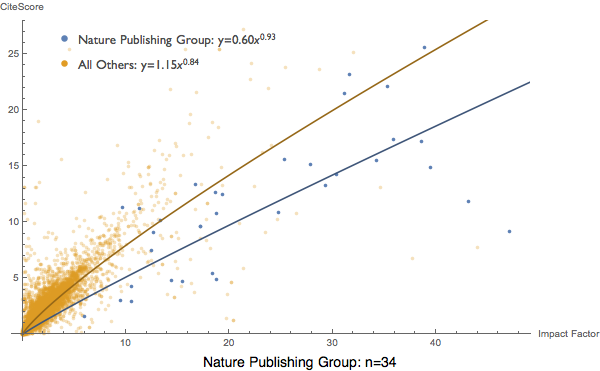
Elsevier journals across the board (even including those from the Lancet Publishing Group) receive CiteScores that are about 10% higher than one would expect given their Impact Factors.
In summary, what we've seen here is that a power law regression analysis fits the data much more robustly while preserving our earlier qualitative conclusions.
So far, we've been using simple regression to look at the data. To simultaneously explore the consequences for multiple publishers, we might want to move to multiple regression. We'll do so in the next post.
To be continued...